
Data Center CFD Analysis: Find Hot Spots, Cut PUE by 30%
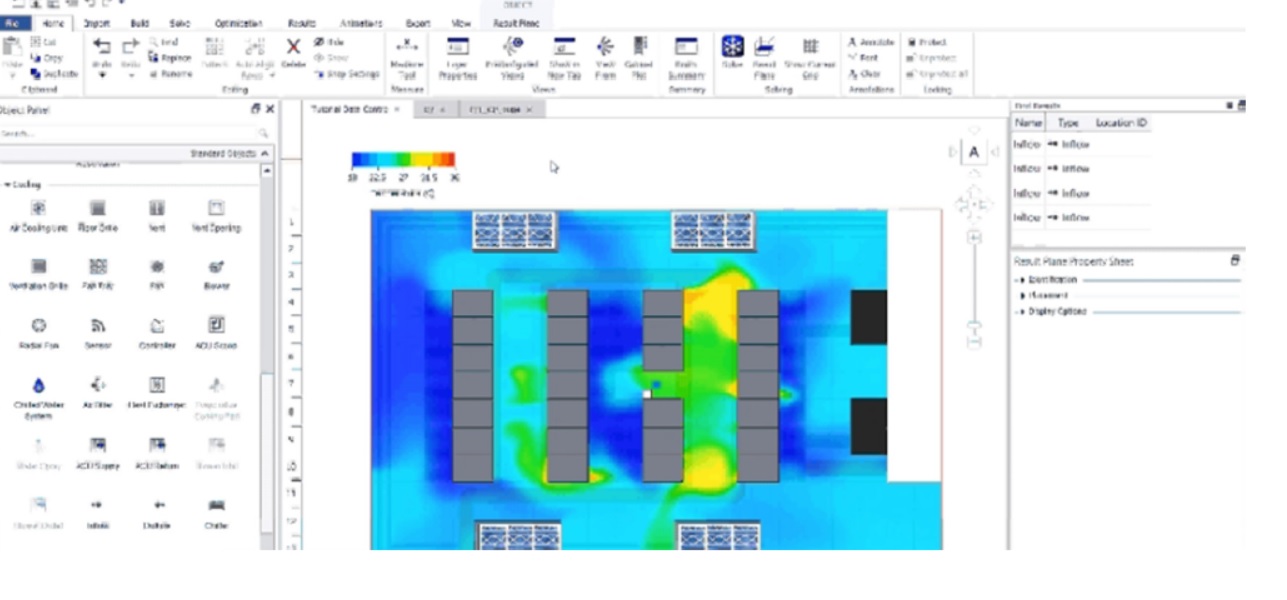
2D temperature contour result — hot spot identification, DCX by Cadence
Most data center hot spots don't announce themselves. There's no alarm when a rack in the corner of aisle 4 is running five degrees hotter than the CRAC unit's readout suggests. Instead, you get quieter symptoms first: a server that throttles under load for no obvious reason, a cooling bill that keeps climbing even though nothing on the floor has changed, or a routine audit that flags a temperature reading nobody can explain.
By the time a hot spot is visible on a handheld thermal camera, it's usually already cost you money — and possibly hardware. This is where Data Center CFD Analysis earns its place in the design and operations process: it finds these problems before they become outages.
What Is a Data Center Hot Spot, Really?
A hot spot is any point in a facility — typically at the server inlet — where air temperature rises above the safe operating range recommended by ASHRAE TC 9.9, even though the room's overall cooling capacity looks adequate on paper. That last part is the key issue. Most data centers aren't under-cooled; they're mis-cooled. Cold air is being produced in sufficient quantity, but it isn't reaching the racks that need it.
Hot spots form for structural reasons, not because a facility lacks refrigeration tonnage:
- Bypass airflow — cold supply air escapes through gaps, cable cutouts, or unsealed floor tiles before it ever reaches a rack.
- Hot aisle / cold aisle recirculation — exhaust heat loops back around a containment gap and re-enters the cold aisle.
- Underfloor obstructions — cable trays, conduit, and abandoned infrastructure choke plenum airflow in ways that aren't visible from the floor above.
- Mismatched tile placement — perforated tiles positioned by habit rather than by measured demand, often starving high-density racks while flooding low-density ones.
- Rack density creep — racks get filled with higher-wattage equipment over time, but the cooling design was never revisited to match.
None of these show up in a facility walk-through. They only show up once you can see the air itself moving.
Why Hot Spots Cost More Than You Think
The direct risk is obvious: sustained inlet temperatures above ASHRAE's recommended envelope shorten hardware lifespan and increase the chance of thermal throttling or shutdown during peak load — exactly when you can least afford it.
The indirect cost is the one most facilities never measure. Operators who don't know where their hot spots are tend to respond the only way they can — by over-cooling the entire room to compensate for problems in a handful of locations. That's a blunt, expensive fix. Running CRAH units harder than necessary across an entire facility to protect three or four problem racks is a significant, ongoing waste of energy, and it's the single biggest reason facilities carry a higher Power Usage Effectiveness (PUE) than their infrastructure should allow.
How CFD Analysis Finds What Sensors Can't
Temperature sensors and handheld thermal cameras tell you where a problem exists. They can't tell you why, and they can't tell you what happens if you change something.
Data Center CFD Analysis builds a high-fidelity 3D digital twin of the facility — every rack, cooling unit, containment wall, and raised-floor obstruction — using tools such as DCX by Cadence or ANSYS Fluent. The simulation solves the underlying fluid dynamics equations to calculate exactly how air moves and how heat is distributed, room by room, at a resolution no sensor grid could practically match.
The output is a set of visual results: temperature contour planes and velocity vector fields that make invisible airflow visible. A recirculation zone that a technician would need weeks of intermittent sensor logging to detect shows up immediately as a color gradient on a result plane.
Just as importantly, CFD lets you test changes before touching anything. Before repositioning a CRAH unit or adding containment, you can simulate the outcome and confirm it actually solves the problem — rather than finding out after the fact that it introduced a new one three racks over.
From Simulation to Solution
A CFD study is only useful if it leads to a concrete fix. Typical outcomes from a Data Center CFD Analysis include:
- Cold aisle / hot aisle containment corrections to stop recirculation at the source
- CRAH/CRAC repositioning or rebalancing so supply air is matched to actual load distribution, not historical guesswork
- Blanking panel and cable management fixes that close the bypass paths draining cold air away from racks
- Tile-by-tile perforation changes based on measured demand rather than assumption
- Rack-level thermal validation for high-density zones before new equipment is deployed
On a recent US facility project studied to ASHRAE TC 9.9 standards, this kind of analysis identified recirculation zones and confirmed a fresh-air supply strategy that improved flow efficiency across the affected aisles — the kind of targeted correction that's only possible once the airflow pattern is actually visible.
What This Means for PUE
Facilities that correct hot spots through CFD-informed changes rather than blanket over-cooling typically see cooling energy reductions in the 10–30% range, directly improving PUE. That's not a marginal number — for a mid-sized facility, it's often the difference between hitting a sustainability target and missing one, and it compounds every month the fix stays in place.
When to Run a Data Center CFD Study
CFD analysis isn't only for facilities already in trouble. It's most valuable at four points:
- Before construction — validating a cooling design while changes are still cheap to make
- Before a retrofit or expansion — confirming new racks won't create recirculation the existing layout can't handle
- After an unexplained thermal event — finding the actual cause instead of guessing
- As part of a recurring compliance or sustainability audit — keeping PUE and ASHRAE TC 9.9 compliance on track as load patterns shift over time
Frequently Asked Questions
How is CFD analysis different from a thermal imaging survey?
Thermal imaging shows you the current temperature at the surface — useful, but static. CFD shows you why that temperature exists and lets you simulate the effect of a fix before you implement it. Most facilities benefit from using both: imaging to identify a suspected problem, CFD to diagnose and solve it.
How long does a Data Center CFD study take?
A single-zone study typically takes 10–20 business days depending on facility size and geometry complexity, from initial geometry setup through final report delivery.
Do small server rooms need CFD analysis, or just large data centers?
Density matters more than raw square footage. A small, high-density server room can have worse recirculation problems than a large, lightly loaded facility. If inlet temperatures are inconsistent or unexplained, size isn't the deciding factor.
Can CFD analysis help with LEED, BREEAM, or WELL certification?
Yes — CFD-based thermal and airflow reports are commonly used as supporting evidence for sustainability and certification submissions, particularly where PUE improvements or occupant comfort standards need to be demonstrated with engineering data rather than estimates.
SuperDesignTech is a specialist Data Center CFD Analysis and Thermal Comfort Analysis consultancy serving the USA, Canada, and Europe, using commercially licensed ANSYS Fluent and DCX by Cadence software. Request a free consultation to find out what's happening in your airflow.
0 Comments
Be the first to share your thoughts on this article.
Leave a Comment