
Thermal Comfort Analysis: A Complete Guide to PMV, PPD & Smart HVAC Design
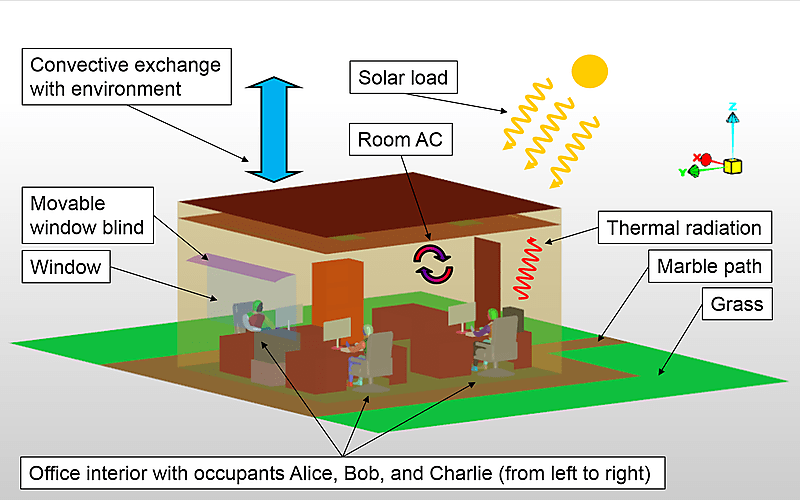
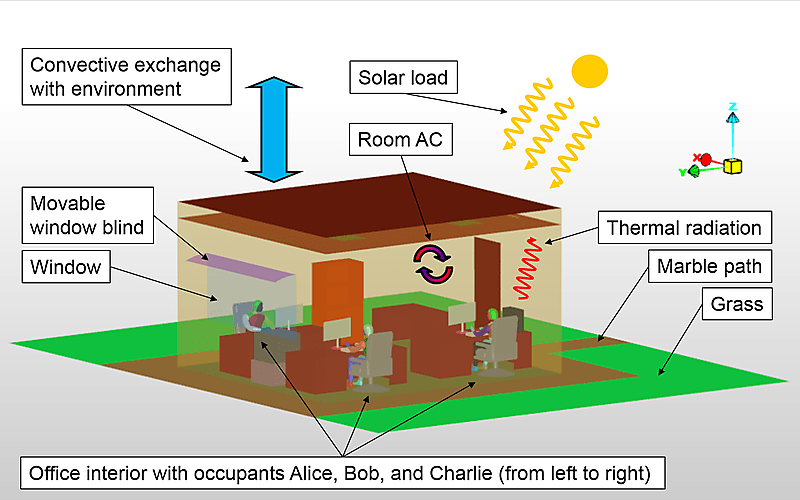
Figure 1: Comprehensive thermal comfort analysis framework showing convective exchange, solar load, thermal radiation, and HVAC systems in a modern office building.
Thermal comfort analysis is the cornerstone of modern building design and HVAC engineering. It goes far beyond simply setting a thermostat to 22°C. True thermal comfort is a complex interaction between the human body, clothing, activity levels, and the surrounding indoor environment. In 2026, as buildings become smarter and sustainability goals tighten, understanding thermal comfort has never been more critical for architects, engineers, and facility managers.
This comprehensive guide explores the science behind thermal comfort, the established PMV-PPD and adaptive comfort models, the revolutionary rise of personal comfort models powered by machine learning, and practical strategies for implementing thermal comfort analysis in your next building project.
1. What Is Thermal Comfort? The Science Explained
1.1 Defining Thermal Comfort
According to ASHRAE Standard 55, thermal comfort is defined as "that condition of mind which expresses satisfaction with the thermal environment." It is fundamentally a subjective experience influenced by both environmental and personal factors.
The human body constantly exchanges heat with its environment through four primary mechanisms:
- Conduction — Heat transfer through direct contact with surfaces
- Convection — Heat transfer via air movement around the body
- Radiation — Heat exchange with surrounding surfaces (walls, windows, ceilings)
- Evaporation — Heat loss through perspiration and respiration
When the rate of heat produced by the body equals the rate of heat lost to the environment, thermal equilibrium — and thus comfort — is achieved.
1.2 The Six Key Variables
Every thermal comfort analysis must account for six input variables, grouped into environmental and personal factors:
| Category | Variable | Typical Range / Value | Measurement Tool |
|---|---|---|---|
| Environmental | Air Temperature (Ta) | 20–26°C (office) | Thermometer / Data logger |
| Mean Radiant Temperature (MRT) | Should match Ta ±3°C | Globe thermometer | |
| Air Velocity (V) | 0.1–0.3 m/s | Anemometer | |
| Relative Humidity (RH) | 30–60% | Hygrometer | |
| Personal | Metabolic Rate (M) | 1.0–1.2 met (office work) | Activity estimation tables |
| Clothing Insulation (Icl) | 0.5–1.0 clo (summer/winter) | Clo value tables |
⚠ Why Mean Radiant Temperature Matters
An often-overlooked parameter is the Mean Radiant Temperature (MRT). A person sitting near a large cold window in winter may feel uncomfortably cool even if the air temperature reads 22°C, because the cold window surface radiates heat away from the body. ASHRAE Standard 55 emphasizes MRT alongside air temperature to define accurate comfort zones.
1.3 Why Thermal Comfort Analysis Matters
Poor thermal comfort has measurable, real-world consequences that extend far beyond simple occupant complaints:
- Productivity Loss: Studies consistently show that thermal discomfort can reduce worker productivity by 6–10%. Cognitive performance, decision-making speed, and creative thinking all decline outside the thermal comfort zone.
- Health Impacts: Extreme thermal conditions contribute to heat stress, cold-related illnesses, and can exacerbate respiratory and cardiovascular conditions.
- Energy Waste: Over-conditioning spaces to compensate for poor comfort prediction leads to unnecessary HVAC energy consumption. HVAC systems account for approximately 50% of building energy use in developed countries.
- Occupant Dissatisfaction: In large office buildings, even when HVAC systems operate within "standard" parameters, dissatisfaction rates often exceed acceptable thresholds, leading to increased turnover and reduced workplace satisfaction.
2. The PMV-PPD Model: Fanger's Legacy and Its Limitations
2.1 Understanding Predicted Mean Vote (PMV)
Developed by P.O. Fanger in 1970, the PMV model remains the most widely referenced thermal comfort index worldwide. It is codified in ISO 7730 and ASHRAE Standard 55.
PMV predicts the average thermal sensation of a large group of people on a seven-point scale:
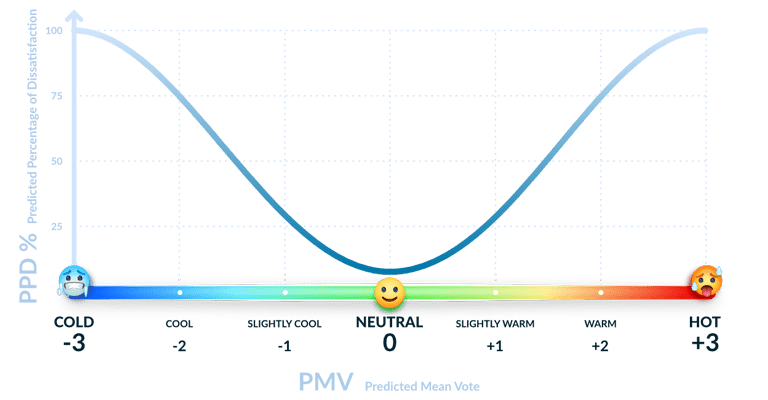
Figure 2: The PMV scale ranges from -3 (Very Cold) to +3 (Very Hot), with 0 representing thermal neutrality. The PPD curve shows that even at perfect neutrality, approximately 5% of people will still be dissatisfied.
| PMV Value | Thermal Sensation | PPD (%) |
|---|---|---|
| +3 | Very Hot | ~99% |
| +2 | Hot | ~75% |
| +1 | Warm | ~25% |
| 0 | Neutral (Optimal) | ~5% |
| -1 | Cool | ~25% |
| -2 | Cold | ~75% |
| -3 | Very Cold | ~99% |
2.2 Predicted Percentage of Dissatisfied (PPD)
PPD estimates the percentage of people likely to feel thermally dissatisfied. The relationship between PMV and PPD is mathematically fixed: at PMV = 0 (neutral), PPD is approximately 5% — meaning even under theoretically "perfect" conditions, some dissatisfaction is inevitable.
The design target for most HVAC systems is to maintain PMV between -0.5 and +0.5, corresponding to a PPD below 10%. This range ensures that the large majority of occupants perceive the environment as thermally acceptable.
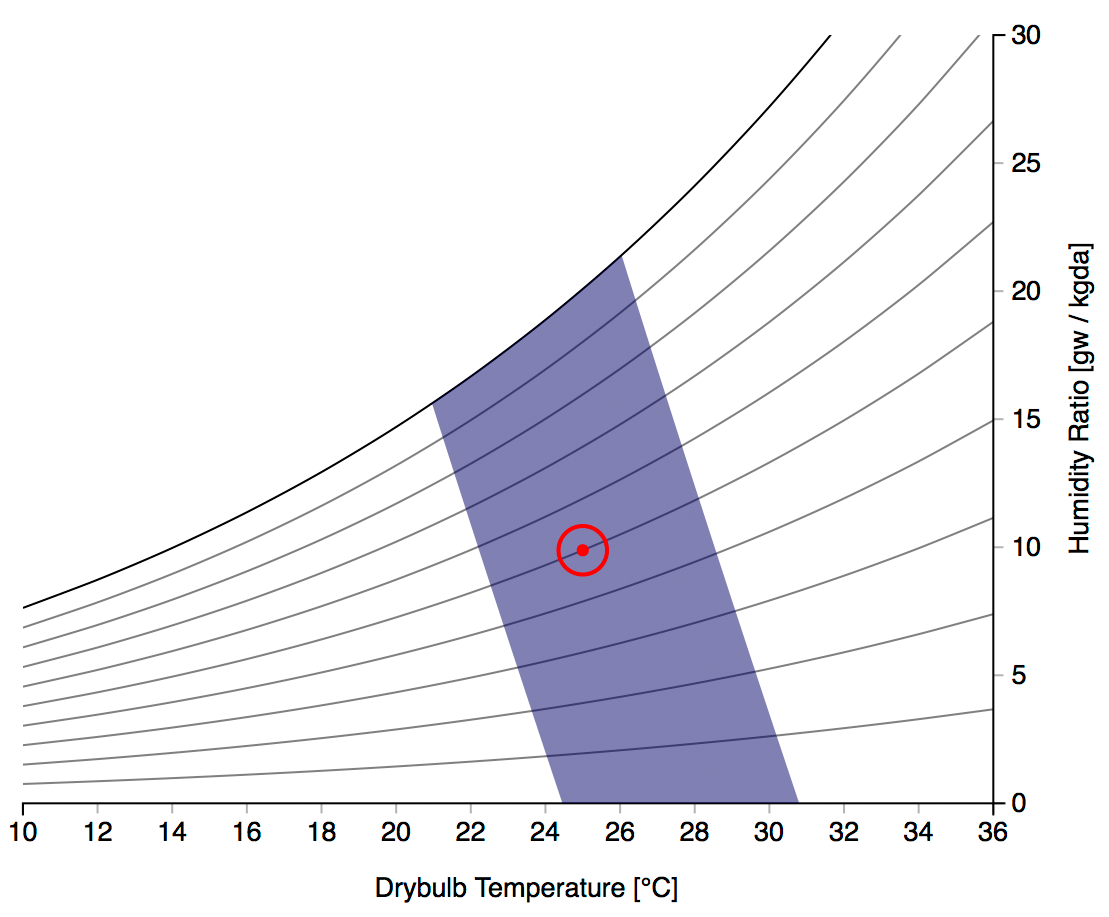
Figure 3: Psychrometric chart illustrating the PMV comfort zone (shaded region) based on dry-bulb temperature and humidity ratio, as defined by ASHRAE Standard 55.
2.3 The Critical Limitations of PMV-PPD
Despite its widespread adoption, recent large-scale analyses have revealed significant shortcomings that every building professional should understand:
📈 The 34% Accuracy Problem
A comprehensive study using the ASHRAE Global Thermal Comfort Database II (containing approximately 107,000 records) found that PMV predicts observed thermal sensation correctly only 34% of the time — meaning it is wrong two out of three times. PMV has a mean absolute error of approximately one full unit on the seven-point thermal sensation scale.
Key limitations include:
- Population-Averaged Bias: PMV was developed from chamber studies on subjects primarily from temperate climates. It tends to overestimate discomfort in naturally ventilated buildings and tropical climates.
- No Individual Variation: The model cannot account for individual metabolic differences, age, gender, body composition, or acclimatization.
- Static Assumptions: PMV assumes steady-state conditions and does not reflect the dynamic nature of real buildings where conditions fluctuate.
- Behavioral Blindness: It ignores adaptive behaviors like opening windows, adjusting clothing, or using personal fans.
3. The Adaptive Comfort Model: Accounting for Human Adaptability
3.1 How the Adaptive Model Works
The adaptive comfort model emerged from extensive field studies showing that people in naturally ventilated buildings accept a wider range of temperatures than PMV predicts. Developed by de Dear and Brager, this model correlates acceptable indoor operative temperatures with the outdoor running mean temperature.
Key Principle: Humans are not passive recipients of their environment — they adapt through:
- Clothing adjustments (adding/removing layers)
- Activity level modifications
- Window opening and natural ventilation
- Fan and personal heater use
- Psychological expectations and preferences
3.2 When to Use the Adaptive Model
The adaptive model is particularly relevant for:
- Naturally ventilated buildings where occupants have operable windows
- Mixed-mode buildings that switch between mechanical and natural conditioning
- Regions with mild climates where outdoor conditions allow passive conditioning for significant portions of the year
- Buildings designed for occupant control and engagement
ASHRAE Standard 55-2020 includes both the PMV-based approach for mechanically conditioned spaces and the adaptive model for naturally conditioned spaces, giving designers flexibility to choose the appropriate framework.
4. Personal Comfort Models: The AI Revolution in Thermal Comfort
4.1 From Population to Individual
The most significant evolution in thermal comfort analysis is the move from population-averaged models to personal comfort models. Traditional models predict the average response of a large group; personal models predict the comfort of a specific individual.
Research from UC Berkeley's Center for the Built Environment demonstrates that personal comfort models based on occupant behavior (such as adjusting a personal comfort chair) achieved a median accuracy of 73%, compared to only 51% for conventional PMV/adaptive models — which performed only slightly better than random guessing in mild indoor environments.
4.2 Machine Learning and Wearable Sensors
Modern personal comfort models leverage three categories of data inputs:
| Data Category | Examples | Collection Method |
|---|---|---|
| Environmental Information | Indoor temperature, humidity, air velocity, CO2 levels | IoT sensors, BMS integration |
| Occupant Behavior | Thermostat adjustments, window opening, fan use, clothing changes | Smart thermostats, occupancy sensors, PCS devices |
| Physiological Signals | Skin temperature, heart rate variability, sweat response, blood flow | Wearable sensors, smart clothing |
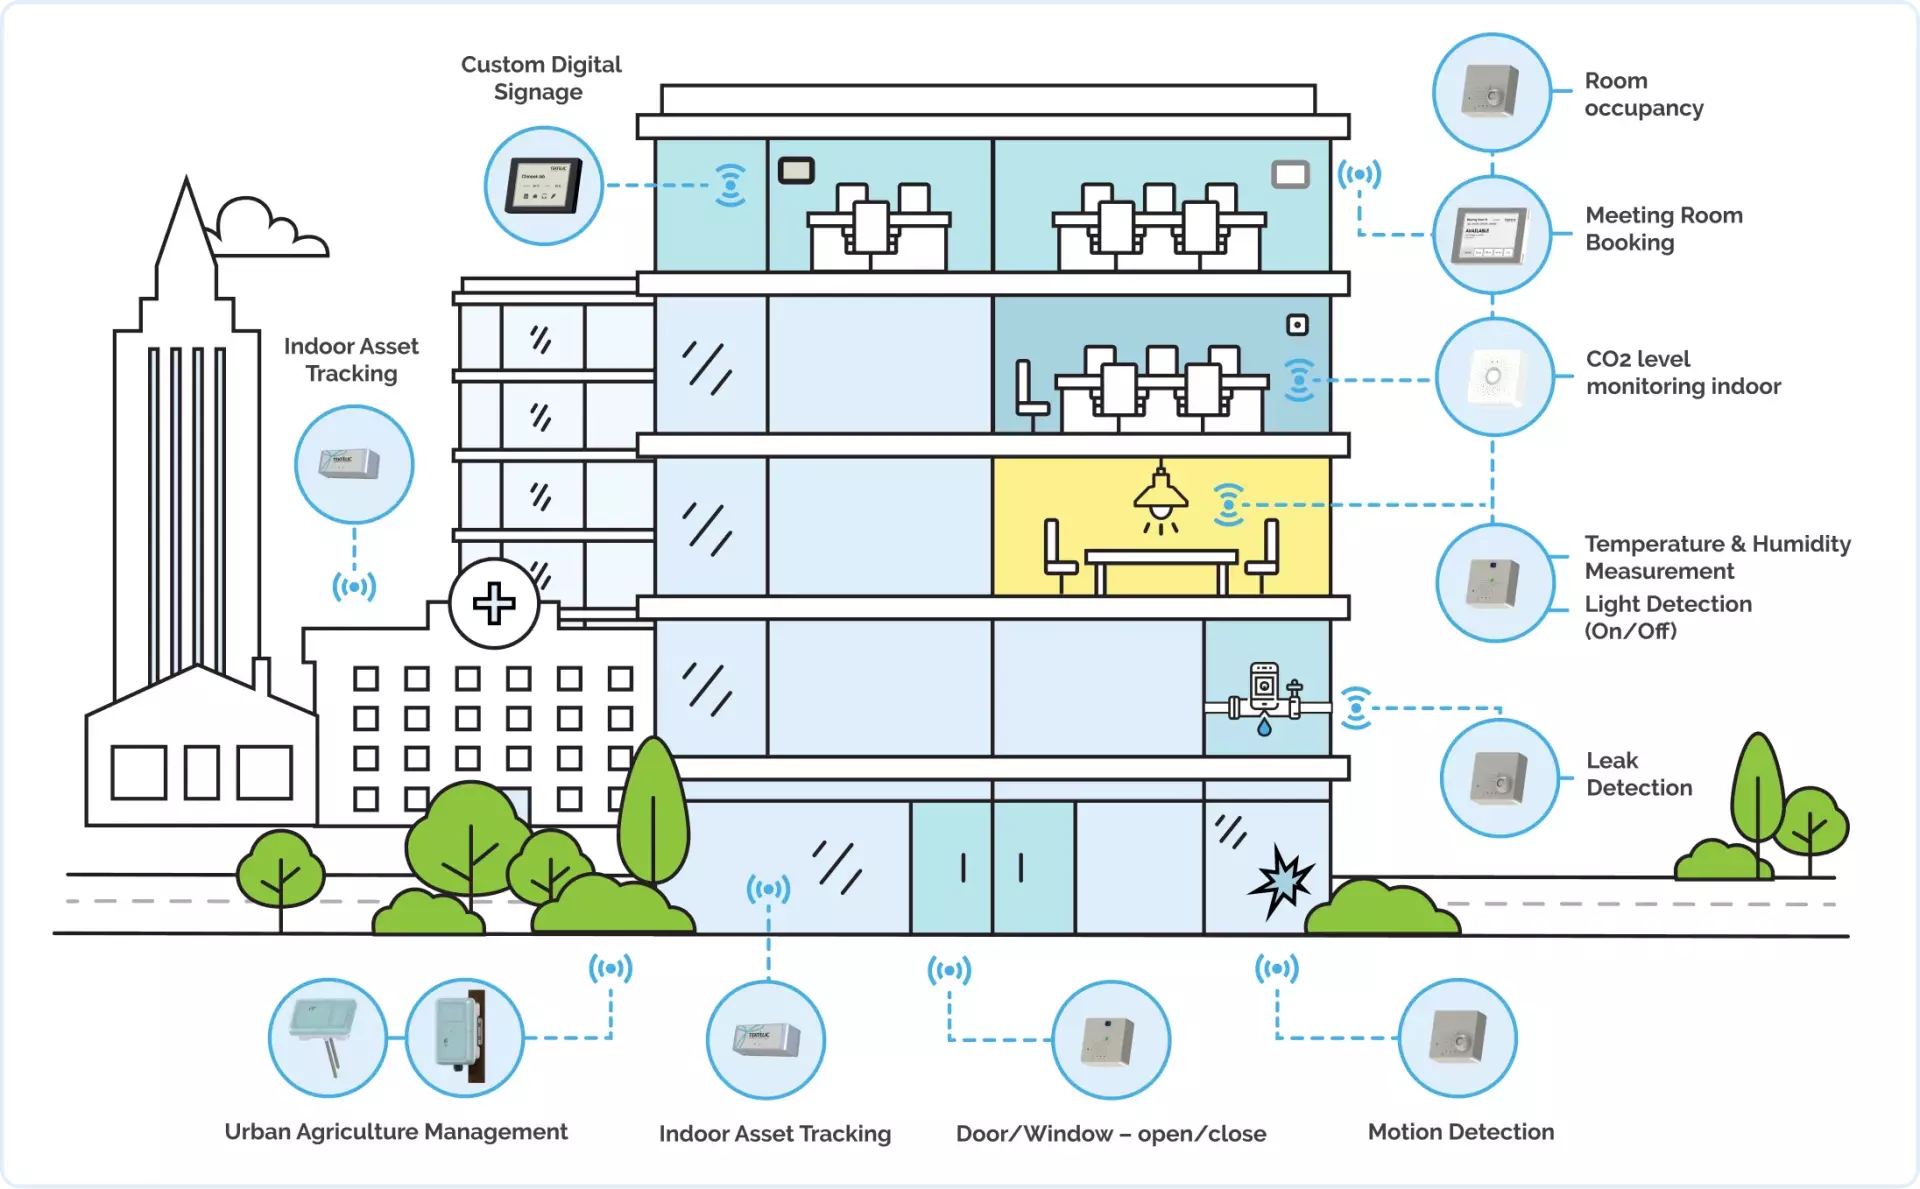
Figure 4: IoT-enabled smart building architecture showing temperature, humidity, CO2, and occupancy sensors integrated with cloud-based thermal comfort analytics.
4.3 Breakthrough Accuracy with AI
A 2024 study established thermal comfort models using machine learning strategies (Random Forest, SVM, Neural Networks) based on physiological parameters including forehead skin temperature, skin blood flow, and sweat area. The Random Forest model achieved the highest accuracy of 89% under combined thermal stimulations.
Another study using wearable sensors found that skin temperature measured at the ankle was more predictive of thermal comfort than wrist measurements, suggesting that smart shoes may be more effective than wristbands for comfort prediction.
4.4 Real-World Benefits
Personal comfort models enable transformative outcomes:
- Occupant-Centric HVAC Control: Zone-level or even desk-level climate control based on individual preferences rather than building-wide averages.
- Energy Savings: One study showed a 12% reduction in average airflow rate while maintaining or improving comfort when personal models were integrated into thermostat control.
- Predictive Conditioning: Anticipating comfort needs before occupants explicitly express dissatisfaction, enabling proactive rather than reactive HVAC management.
- Health and Wellbeing: Better thermal comfort correlates with improved sleep quality, reduced sick building syndrome symptoms, and enhanced cognitive performance.
5. Climate-Specific Thermal Comfort Considerations
5.1 Hot and Humid Climates
Research in Sub-Saharan Africa has shown that Fanger's PMV model significantly overestimates thermal discomfort in hot-humid regions. The comfort temperature felt by people in Douala, Cameroon was 26.1°C, while the Fanger model predicted an optimal value of 23.9°C — an error of over 8%.
This discrepancy arises because:
- Populations in hot-humid climates have adapted thermophysiologically (skin characteristics modified by climate over generations)
- The Fanger model was based on data from temperate-zone subjects
- Local cultural practices, clothing patterns, and expectations differ from Western norms
Modified models incorporating region-specific skin temperature parameters have shown errors reduced to just 1.5–2%, compared to 8–9% with the standard Fanger model.
5.2 Cold Climates and Aging Populations
In cold environments, the PMV model has been found to underestimate evaporative heat loss and overestimate mean skin temperature at comfort states. A new Modified PMV (MPMV) model addresses these issues, particularly for older adults who have lower metabolic rates.
The MPMV model fits measured thermal sensation votes with a correlation coefficient of 0.97, compared to PMV's overestimation of 36% in some conditions. This is especially important as global populations age and building designs must accommodate the thermal needs of older occupants.
6. Practical Implementation in Building Design
6.1 Step-by-Step Design Workflow
Step 1: Define the Comfort Strategy
Determine whether the building will be fully conditioned, naturally ventilated, or mixed-mode. Select the appropriate comfort model:
- PMV-based approach for sealed, mechanically conditioned buildings
- Adaptive model for naturally ventilated or mixed-mode buildings
- Personal comfort models for smart buildings with IoT infrastructure
Step 2: Measure and Calculate Key Parameters
Collect data at occupant level (0.1–1.1 m height):
- Air temperature and relative humidity
- Mean Radiant Temperature using globe thermometers or surface temperature measurements
- Air velocity using anemometers
- Estimate metabolic rates based on activity (1.0–1.2 met for office work, 1.6–2.0 met for light manufacturing)
- Assess clothing insulation (0.5–1.0 clo for typical office environments)
Step 3: Analyze and Optimize
- Calculate PMV and PPD for representative zones
- Check for local discomfort factors: radiant asymmetry, draft, vertical air temperature differences
- Consider surface temperature control through insulation, shading, and reflective materials
- For radiant systems, ensure uniform panel temperatures to avoid asymmetric radiation
Step 4: Integrate Adaptive Opportunities
- Provide operable windows where climate and air quality permit
- Install personal comfort systems (task fans, heated/cooled chairs)
- Allow thermostat adjustments within reasonable ranges
- Design for clothing flexibility (lobbies, transition zones, locker facilities)
6.2 Standards and Compliance
| Standard | Scope | Key Application |
|---|---|---|
| ASHRAE Standard 55-2020 | Defines thermal environmental conditions for human occupancy | Primary reference for North American HVAC design |
| ISO 7730:2005 | Ergonomics of the thermal environment — PMV/PPD calculation | International standard for thermal comfort assessment |
| ISO 7726 | Specifies instruments for measuring thermal environment parameters | Calibration and measurement protocol reference |
| ASHRAE Handbook — Fundamentals | Detailed methods for radiant heat exchange and comfort calculations | Engineering calculation reference |
| EN 15251 / ISO 17772 | Indoor environmental input parameters for building design | European building energy performance standards |
6.3 Troubleshooting Common Comfort Issues
| Problem | Likely Cause | Solution |
|---|---|---|
| Discomfort despite stable air temperature | Radiant temperature asymmetry (cold windows, hot ceilings) | Check MRT; add insulation, low-e glazing, or shading |
| Localized cold spots | Poor diffuser placement or radiant imbalance | Adjust air velocity/direction; analyze surface temperatures |
| High dissatisfaction in "compliant" building | PMV model inaccuracy for local climate/population | Consider adaptive model or region-specific modifications |
| Energy waste from over-conditioning | PMV overestimating discomfort | Widen setpoints based on actual occupant feedback; use personal models |
| Draft complaints | Excessive air velocity or poor diffuser design | Reduce velocity below 0.2 m/s; use displacement ventilation |
7. The Future of Thermal Comfort Analysis
7.1 Integration with Smart Buildings
The future of thermal comfort lies in dynamic, data-driven systems that:
- Continuously learn from occupant feedback and behavior patterns
- Integrate with Building Management Systems (BMS) for real-time optimization
- Use IoT sensors and wearable devices for personalized control
- Leverage digital twins to simulate comfort scenarios before physical implementation
- Combine environmental data with calendar integration (meeting rooms, occupancy forecasts)
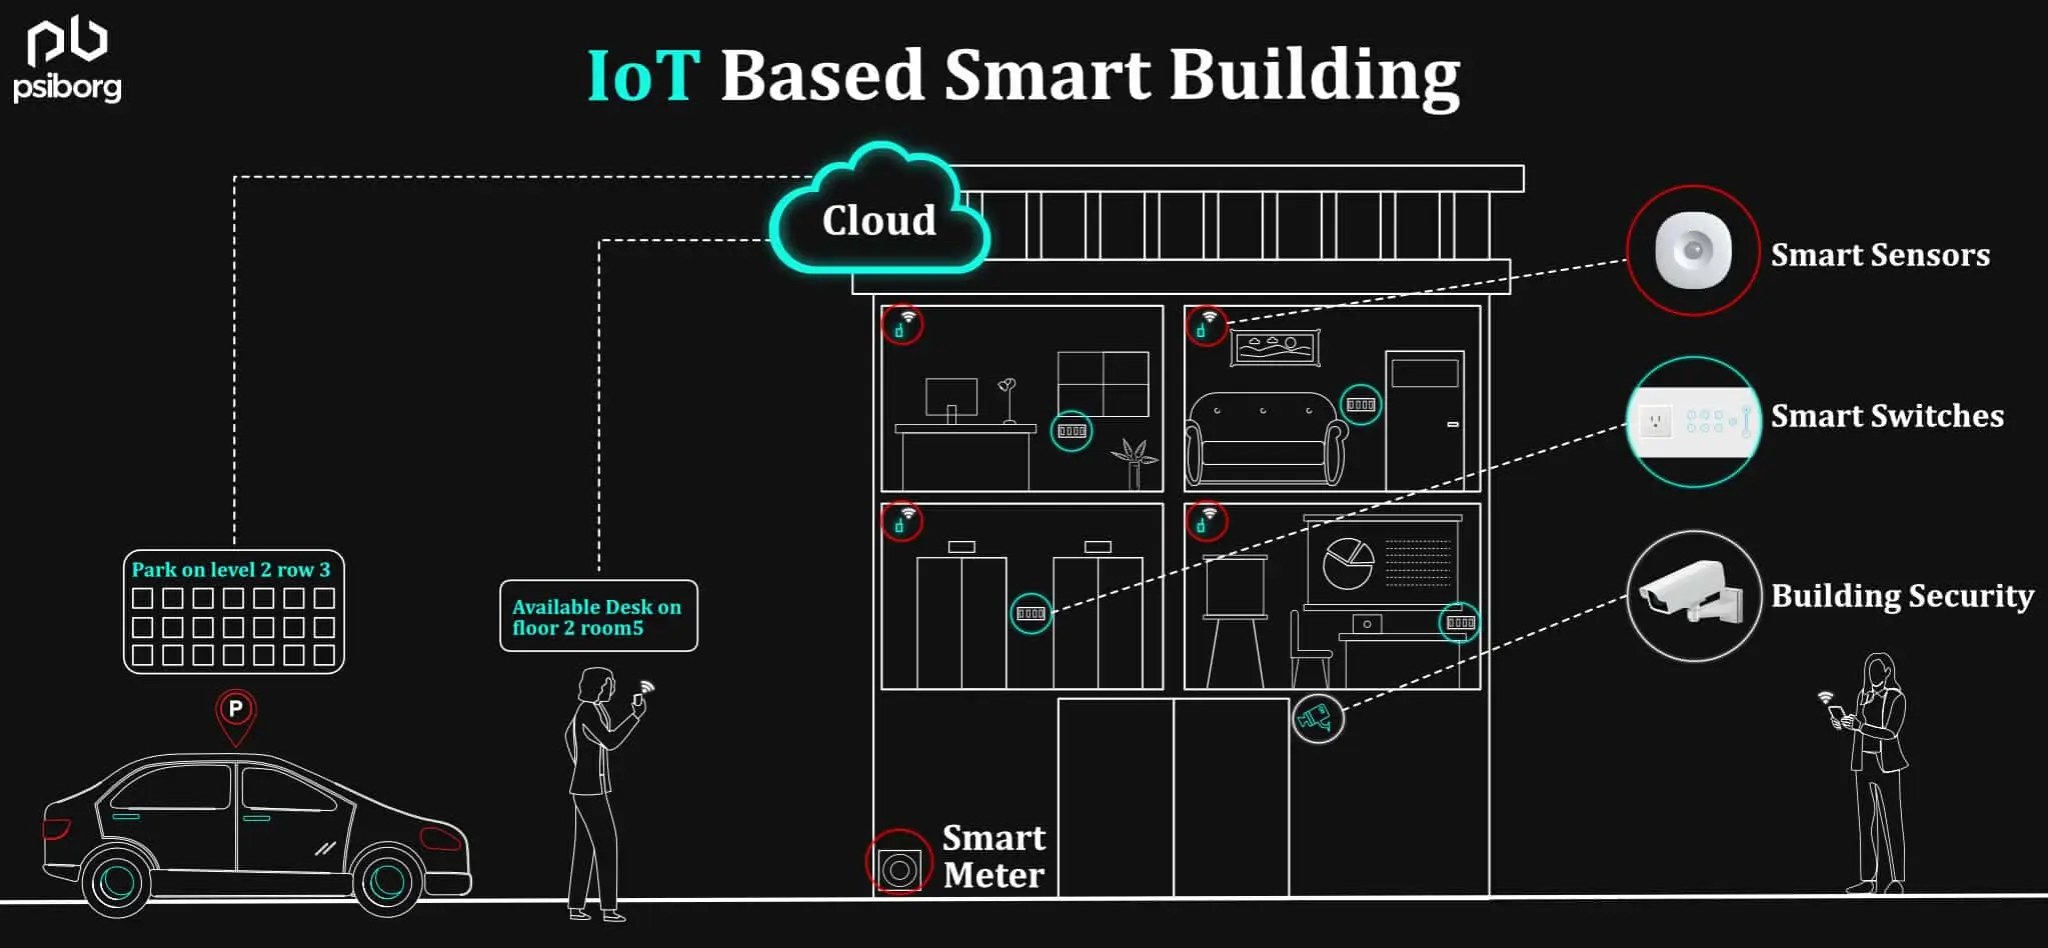
Figure 5: IoT-based smart building ecosystem connecting sensors, cloud analytics, and occupant interfaces for real-time thermal comfort optimization.
7.2 Hybrid Approaches
Rather than abandoning established models entirely, the field is moving toward hybrid approaches:
- Using PMV as a baseline for mechanically conditioned spaces during peak loads
- Applying adaptive models for free-running periods and shoulder seasons
- Layering personal comfort models for fine-tuned, occupant-specific control during occupied hours
- Combining all three approaches within a single building depending on zone type and time of day
7.3 Standardization and Privacy Challenges
As personal comfort models gain traction, the industry faces important challenges:
- Data Standardization: Developing universal protocols for sensor data collection and model training across different manufacturers and platforms
- Privacy and Security: Ensuring physiological data from wearables is protected while still enabling effective comfort prediction
- Certification: Creating certification methods for AI-driven comfort systems to ensure reliability and safety
- Accessibility: Ensuring advanced comfort technologies are affordable and accessible across building types and economic sectors
💡 Key Takeaway for 2026
Thermal comfort is not a static target but a dynamic, occupant-centered experience. The most successful building projects in 2026 will combine the rigor of established standards (PMV, adaptive) with the personalization of AI-driven models, all while respecting occupant privacy and minimizing energy consumption.
Conclusion
Thermal comfort analysis has evolved dramatically since Fanger's groundbreaking work in 1970. While the PMV-PPD model remains a valuable reference for HVAC design, its limitations — particularly its 34% accuracy rate in real buildings — have catalyzed a paradigm shift toward more nuanced, occupant-centered approaches.
The adaptive comfort model recognizes human adaptability and the value of occupant control, while personal comfort models leverage machine learning and wearable technology to predict individual needs with unprecedented accuracy. For building professionals, the path forward is clear: thermal comfort must be designed as a dynamic system, not a static setpoint.
As buildings become smarter and sustainability goals tighten, the integration of advanced thermal comfort analysis will be essential not only for occupant satisfaction and productivity but also for achieving the energy efficiency targets that sustainable design demands. The buildings of tomorrow will not just condition air — they will understand and respond to the people inside them.
Ready to Optimize Your Building's Thermal Environment?
Start by measuring your current conditions against ASHRAE 55 and ISO 7730 standards. Consider how emerging personal comfort technologies and IoT sensors could transform occupant satisfaction in your next project.
0 Comments
Be the first to share your thoughts on this article.
Leave a Comment